Easy Performance Fixes Guided By Flame Graphs
When I was in grad school and struggling with my Master’s thesis, I started a small side project in order to distract myself and work on something that felt more rewarding. This project was basically a clone of vim – a terminal-based text editor I called badavi. That was around seven years ago. I haven’t worked on it continuously since then, but I would occasionally go back and hack on it in short little bursts. In particular I’ve been doing this the last couple of months, and I thought it might be interesting to write about some of the things I’ve been up to.
For this post, we’ll look at some small performance fixes I made recently, guided by perf and flame graphs.
Just for context, badavi is a small C project, something like 5000 lines currently. It looks like this (click to expand):
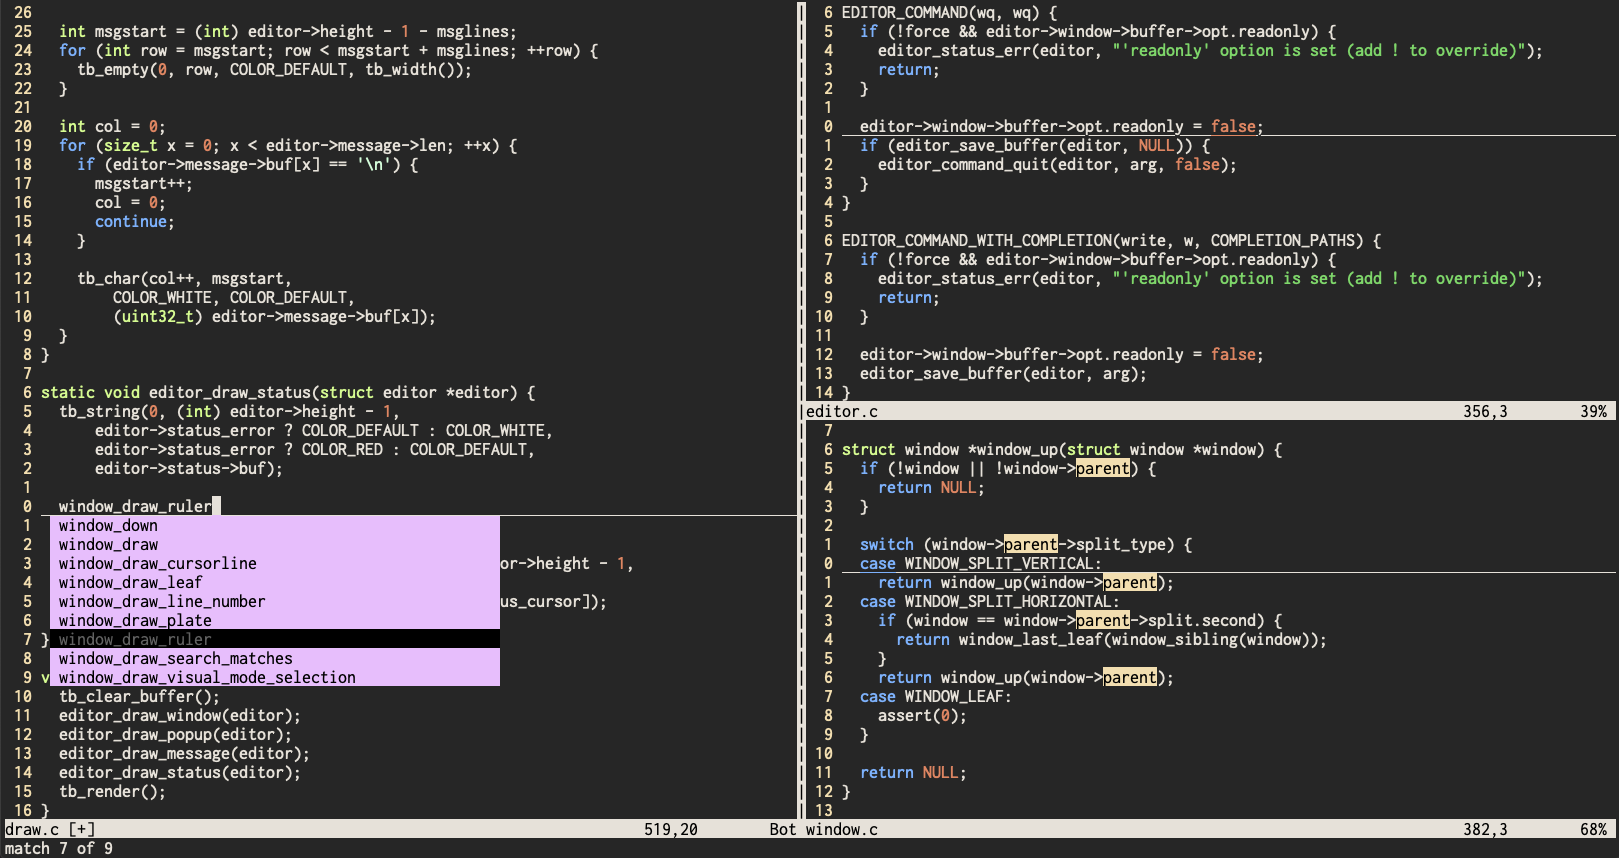
Some features showcased there are split windows, insert mode completion (based on ctags), searches, and syntax highlighting.
The other day I was playing around with perf and flame graphs and decided to
see if there were any low hanging fruit performance improvements that could be
made, since I had never profiled the editor before. I used perf record -g to
profile a short session where I just opened a source file and jumped around the
file using various motions, and generated the corresponding flame graph:
$ perf record -g badavi editor.c
$ perf script | FlameGraph/stackcollapse-perf.pl > out.perf-folded
$ FlameGraph/flamegraph.pl out.perf-folded > perf.svg
This was the result:

From this we can see that the majority of the time was spent inside
editor_draw. As background, badavi uses a library called termbox to
interact with the terminal. termbox uses an array of cells as an abstraction
over the terminal grid; each cell is composed of a character, a foreground
color, and a background color. In the code, “drawing” refers to the process of
populating this array with the right characters and colors for each cell on the
screen. The array is repopulated from scratch every time we redraw the screen.
Within editor_draw, we see a few different code paths, but the two dominant
ones are the syntax highlighting machinery (which begins at syntax_token_at)
and a call to gb_linecol_to_pos.
Focusing in on the latter, what’s happening there is that for a given window,
we need to populate the array with the portion of the corresponding file text
that is visible on the screen. The window knows which line-and-column positions
are visible, but in order to read the corresponding characters from memory,
these positions need to be converted to offsets from the start of the file (the
file text is represented in memory as a gap buffer, which is similar to a
big array of characters that can accessed by index). This is what
gb_linecol_to_pos does, and it was being called once per cell.
The way this works right now is that alongside the text, the code also maintains an array of integers storing the length of each line. Converting a line number to an offset involves traversing this array of line lengths and adding them up, so the operation is linear in the number of lines.
I’ve considered changing this array from storing line lengths to storing the
offsets of each newline (or viewed another way, partial sums of the line
lengths). Then gb_linecol_to_pos could be implemented in constant time, at
the cost of making edits more expensive. I might do that in the future, but in
this case, there was an easy win if just avoid calling it repeatedly like this;
instead, we can get the offset of the first visible character, and increment it
as needed for subsequent characters instead of recomputing it from scratch.
That change can be viewed here:
https://github.com/isbadawi/badavi/commit/2eceda3db447832fd84b8bc6cc0b9e969e769659.
With this change, the flame graph looked like this:

The time was now dominated by syntax highlighting. One of the reasons syntax highlighting is expensive is that we end up scanning the whole file, not just the visible part, just in case we find the start of a block comment or multiline string (depending on the language), which would affect how the visible characters should be colored. I had some bigger improvements in mind for this, so I decided to just set it aside for now, and just disabled syntax highlighting to see if anything else interesting came up. That looked like this:

We see two other code paths that lead to gb_linecol_to_pos and
gb_pos_to_linecol (the reverse operation, also linear in the number of
lines). The code path on the right (motion_apply -> down) is the
implementation of the G motion. As in vim, hitting G in normal mode jumps
to the bottom of the file. I hadn’t noticed that it was slow, since I mostly
work with small source files, but I opened a large 25000-line source file just
to see, and found that there was indeed a very noticeable delay after hitting
G.
The root cause of the slowness turned out to be a hack that I had put in seven years prior, when I first implemented most of the basic motions.
As in vim, motions in badavi can be prefixed with an integer count, which can
usually be understood as how many times to repeat the motion. For example,
34j means to repeat j 34 times, where j means to move down one line.
Given this, I had written some generic code where motions were represented as
functions that returned a new position, and specifying a count caused the
function to be invoked repeatedly in a loop.
But G works slightly differently; 34G means to jump to line 34, not to
repeat G 34 times. For whatever reason, I decided back then to awkwardly fit
G into this “repeated motion” model by implementing it as a repeated j from
the top of the file, so that for example in a file with 25000 lines, hitting
G would start from the top of the file and essentially do 25000j. And as
the flame graph shows, the implementation of j calls gb_linecol_to_pos and
gb_pos_to_linecol. This means G was quadratic in the number of lines.
I don’t really understand why I did it this way; since G ends up being
special cased anyway, we might as well special case it to directly compute the
right offset. (Actually it seemed like many of the motions, such as j in this
example, could be optimized if they were aware of the count instead of being
blindly called repeatedly, but I decided to leave that for later). The change
can be viewed here:
https://github.com/isbadawi/badavi/commit/3f64704a9dd4c768880f71f7693e7240c44c7529.
Here is the corresponding flame graph:

The other code path leading to gb_pos_to_linecol was the code that displays
the line number for each line. badavi supports relative line numbers, similar
to vim, where rather than displaying the actual line numbers, we display the
line numbers relative to the line number of the cursor (this can be seen in the
screenshot above). In the code, windows keep track of their cursor position as
an offset, so it needs to be converted to a line number, and
window_draw_line_number just happened to repeatedly recompute it instead of
doing it once and reusing it. That fix can be viewed here:
https://github.com/isbadawi/badavi/commit/13bb413011c9d3cb1732961a3dd069d45aa87105.
And the corresponding flame graph:

There’s not as much an obvious bottleneck here, and we see a broad mix of code paths being represented, including the dynamic linking that happens at process spawn time, the loading of the source file, and the ctags file, so this seemed like a good place to stop for now.
I found this process to be pretty rewarding. In general, profiling an application and looking at flame graphs can often quickly lead to a lot of “obvious” insights that may not have been so obvious just from reading the code (especially if this is the first time profiling this application). Not all issues are as simple to track down and fix as the ones described in this post, but I think it is often the case that many problems become easy if you can just see what a program is actually doing.